Trying to perform ad-hoc analytics on your customer’s Resources in LogicMonitor? It’s easy to do with the ReportMagic Free Tier using one of our Library Report Templates.
Just follow these steps:
- Sign in
Sign In with your Microsoft Account at https://reportmagic.net/ If you are the first person in your company to sign in, you will become your company’s Magic Suite Administrator.
- Add a LogicMonitor Connection
Go to https://reportmagic.net/admin/connections and add a LogicMonitor Connection. Full details can be found here: https://reportmagic.net/help/connecting_logicmonitor
- Create a report output folder
ReportMagic has a built-in file system - you can find it here: https://reportmagic.net/files .
Just create a new Folder and call it “LogicMonitor Resources”.
- Create a Report Schedule
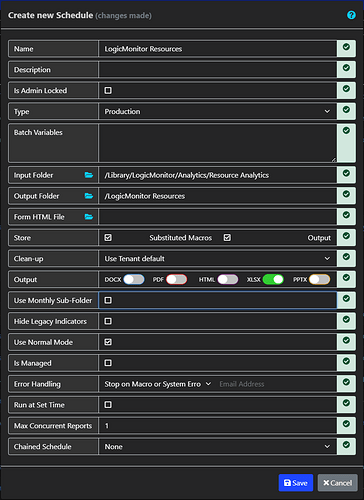
Create a Report Schedule here: https://reportmagic.net/schedules. You just need to give it a name and select the Input and Output folders. Your Input folder should be set to /Library/LogicMonitor/Analytics/Resource Analytics . Make sure that only XLSX Output is selected. Your Schedule should look something like this:
- Run the Report Schedule
Run the Report Schedule. The report may take a few minutes to run if you have more than a few hundred LogicMonitor Resources. You can close your browser and come back later if necessary!
- Download the file
Your output file will appear here: https://reportmagic.net/files?path=%2FLogicMonitor%20Resources . Download the file and open it in Excel.
- Set up your Measure
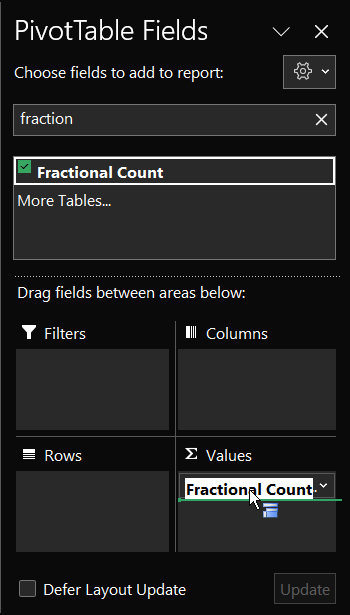
In Excel, click on the “Device Analytics” tab and then click on the PivotTable. You should get a “PivotTable Fields” dialog on the right hand side of Excel. Search for “Fractional Count” and drag that to the bottom-right-hand “Values” field.
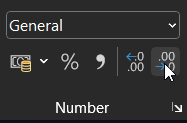
Select the number under "Sum of Fractional Count and click on the “Decrease Decimal” button in the Excel Ribbon until it is showing an Integer:
Note: We use Fractional Count, as LogicMonitor Resources can be members of multiple Resource Groups. You can also use “Count”, but it may not have the desired results.
- Set up your dimensions
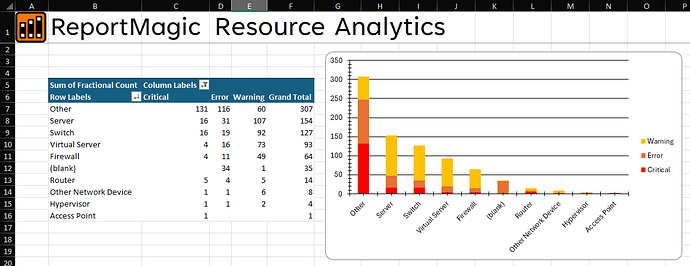
Now you can browse the available dimensions. Every possible Custom, Inherited and AutoProperty is available. Drag, stack and re-order dimensions in Filters, Columns and Rows.
- Explore the data
There dozens of great use cases for LogicMonitor Resource Analysis reports! Try some of the following:
- Firmware versions of all your Cisco devices
- Alert Status of your IDRACs
- Resource Count by customer (try using Group Levels in your rows)
- Review all Resources in SDT
- Find Resources with Last Data received more than a month ago
We’d love to hear how you’re using LogicMonitor Analysis reports!


